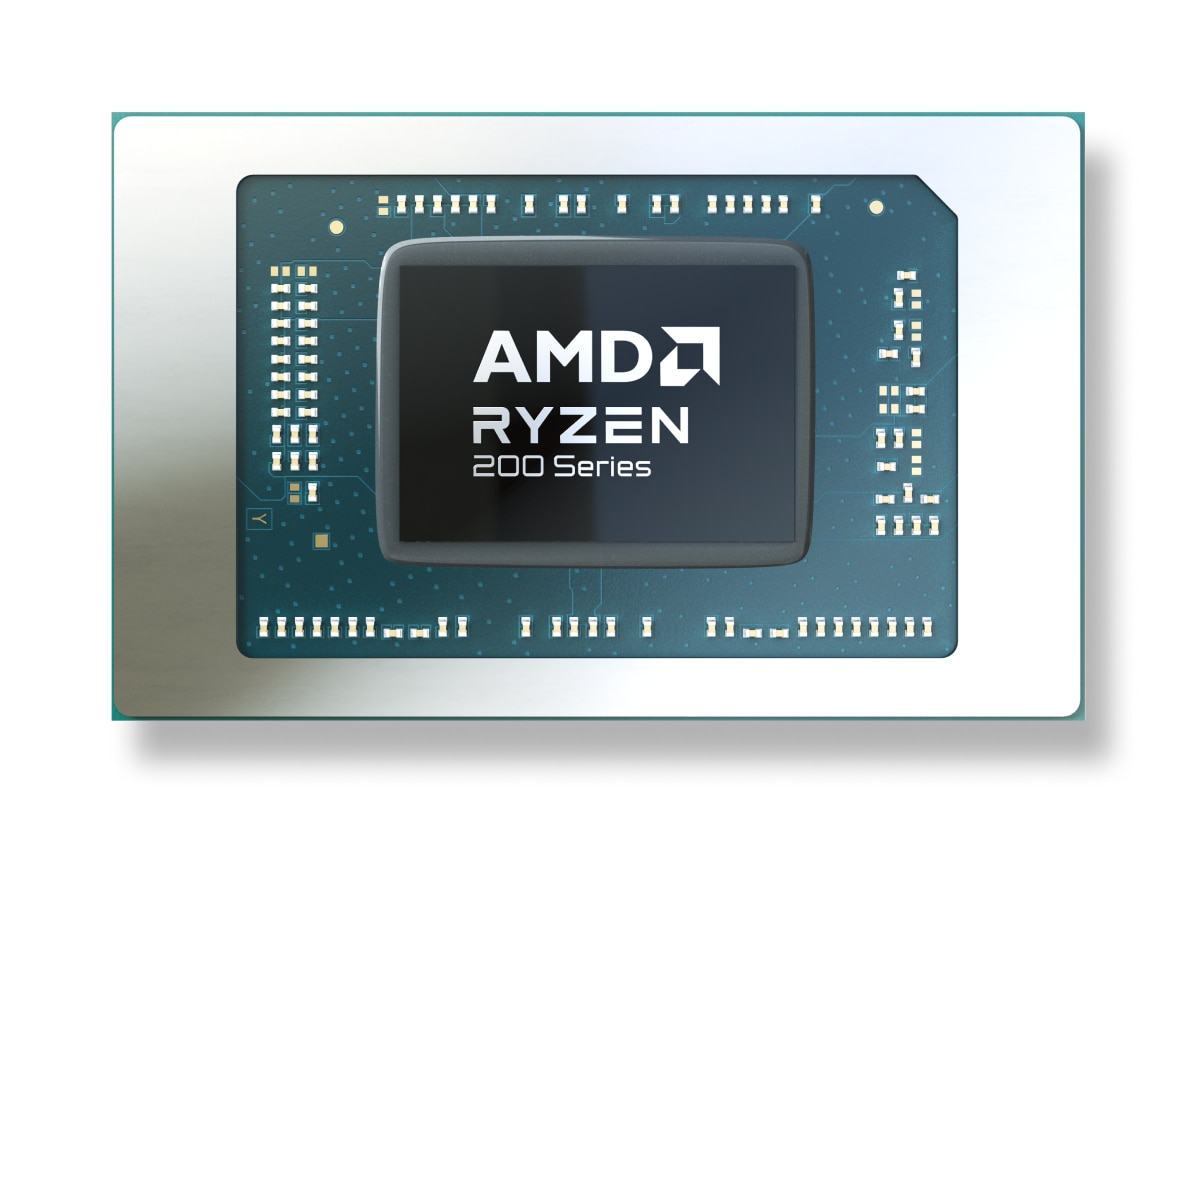
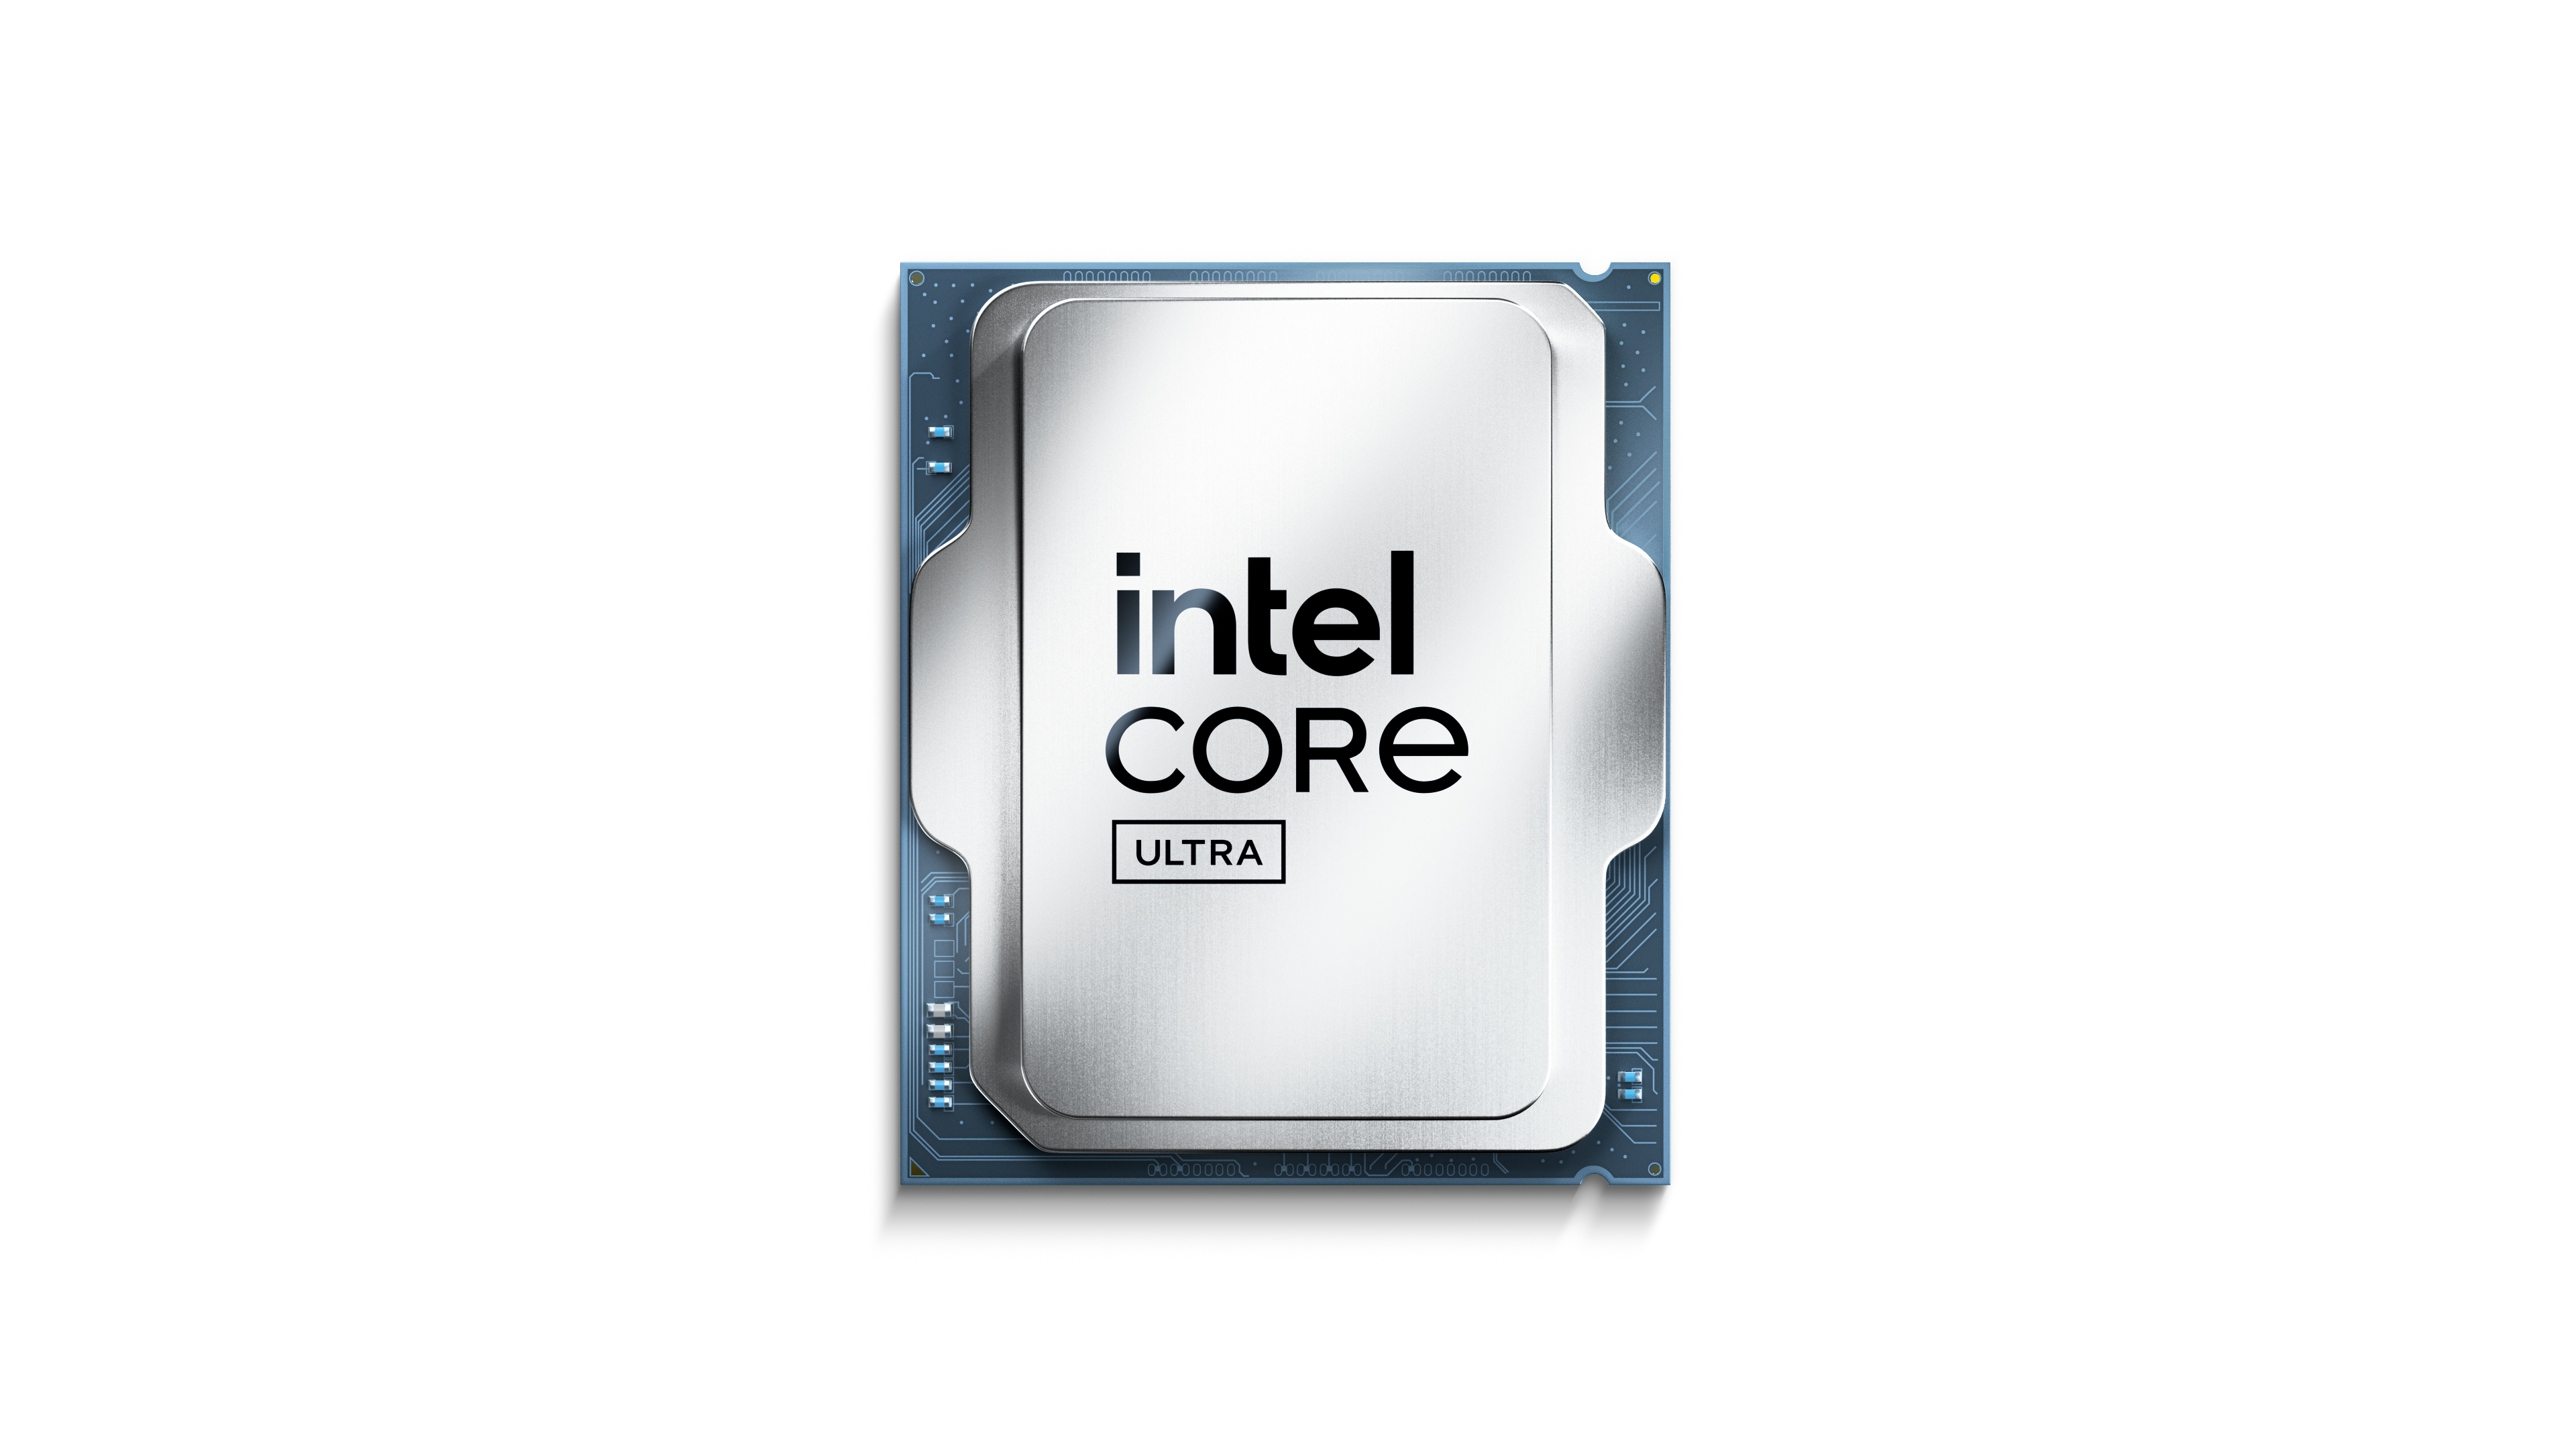
产品系列示意图。
什么是最好的选择 AMD Ryzen 9 7950X 或 Intel Core Ultra 9 285K? 哪种处理器更快?
Compare the available specifications of these models.
AMD Ryzen 9 7950X has a base frequency of 4.5 GHz. 16 / 32 CPU Cores / Threads. Stated TDP / base power 170 W. 发布于 2022-09-27.
Intel Core Ultra 9 285K has a base frequency of 3.70 GHz. 24 / 24 CPU Cores / Threads. Stated TDP / base power 125 W. 发布于 Q4/2024.
需要考虑的原因 在总排名中的位置
(基于几个基准)
 地点
地点
更高的时钟速度
左右 22% 更好的时钟速度
 3.70 GHz
共同立场 AMD Ryzen 9 7950X 在流行的基准测试中的CPU,用于与其他型号进行比较.
需要考虑的原因 更多的核心数量
8 more cores
16
Lower stated TDP / base power
Power limits alone do not measure performance per watt.
170 W
AMD Ryzen 9 7950X
有关被比较的处理器、系列、代数和细分市场的背景信息。
 -
Intel Core Ultra 200
-
-
-
Desktop
-
-
Intel Core Ultra 200
-
-
-
Desktop
-
Core counts, threads, cache and clock modes describe the CPU configuration. Performance depends on the workload and comparable measured results.
3.7 GHz
-
-
24
24
-
-
-
5.7 GHz
-
3.2 GHz
4.6 GHz
16
3.7 GHz
5.5 GHz
8
内部图形不影响CPU的性能,在没有显卡或在移动设备上执行显卡的工作。
-
-
-
-
用于编码和解码内容的内置编解码器。大大地加快了所需的操作。
-
-
-
-
-
-
-
-
支持的RAM的类型、通道数量 Intel Core Ultra 9 285K 和 AMD Ryzen 9 7950X. 根据主板的不同,可能支持更高或更低的内存频率。
-
256 GB
-
2
DDR5-6400
-
-
比较TDP的要求 AMD Ryzen 9 7950X 和 Intel Core Ultra 9 285K Power specifications describe different manufacturer limits. TDP, base power and maximum turbo power are separate values; they do not establish measured system consumption.
-
-
-
250 W
125 W
架构、接口、所支持的额外指令 AMD Ryzen 9 7950X 和 Intel Core Ultra 9 285K, 虚拟机技术和工艺技术。
Arrow Lake
-
-
-
40 MB
36 MB
Q4/2024
FCLGA1851
TSMC N3B
-
36 MB
Shared tests with results for both models: 9
Each row uses one Blender version, operating system and compute backend.
| Test and settings | AMD Ryzen 9 7950X | Intel Core Ultra 9 285K | Result difference¹ |
|---|---|---|---|
| Blender 5.2.0 / CPU / Linux | 635.78393 samples/min Submissions: 9 | 610.826915 samples/min Submissions: 16 | -3.9 % |
| Blender 5.2.0 / CPU / Windows | 555.135698 samples/min Submissions: 14 | 572.277943 samples/min Submissions: 70 | +3.1 % |
| Blender 5.1.1 / CPU / Windows | 577.564381 samples/min Submissions: 26 | 607.399504 samples/min Submissions: 41 | +5.2 % |
| Blender 5.1.0 / CPU / Windows | 599.189804 samples/min Submissions: 15 | 605.487015 samples/min Submissions: 24 | +1.1 % |
| Blender 4.5.0 / CPU / Linux | 640.195415 samples/min Submissions: 60 | 646.581739 samples/min Submissions: 23 | +1.0 % |
| Blender 4.5.0 / CPU / Windows | 539.85203 samples/min Submissions: 186 | 560.391684 samples/min Submissions: 256 | +3.8 % |
| Blender 4.4.0 / CPU / Windows | 533.737601 samples/min Submissions: 202 | 553.668977 samples/min Submissions: 108 | +3.7 % |
| Blender 4.3.0 / CPU / Windows | 521.842157 samples/min Submissions: 504 | 542.577524 samples/min Submissions: 84 | +4.0 % |
| Blender 4.2.0 / CPU / Windows | 527.799756 samples/min Submissions: 470 | 556.959569 samples/min Submissions: 66 | +5.5 % |
¹ Difference of the second result relative to the first in that row. No percentage is calculated for different upscaling algorithms. This compares published results, not a universal performance index.
These results have no shared test of both models with the same version and settings. They are shown separately without a percentage difference.
Published measurements are separate from the archived index. Incomplete conditions and unknown run counts do not support ranking positions or calculated performance differences.
| Model | Test | Result | Reported conditions |
|---|---|---|---|
| Intel Core Ultra 9 285K | Cinebench R15 / multi-core | 6588 points | |
| AMD Ryzen 9 7950X | Cinebench R15 / multi-core | 6236 points | Graphics card: GeForce RTX 3090 System RAM: 32 GB |
| Intel Core Ultra 9 285K | Cinebench R15 / single-core | 356 points | |
| AMD Ryzen 9 7950X | Cinebench R15 / single-core | 317 points | Graphics card: GeForce RTX 3090 System RAM: 32 GB |
| Intel Core Ultra 9 285K | Cinebench R20 / multi-core | 16722 points | |
| AMD Ryzen 9 7950X | Cinebench R20 / multi-core | 14891 points | Graphics card: GeForce RTX 3090 System RAM: 32 GB |
| Intel Core Ultra 9 285K | Cinebench R20 / single-core | 902 points | |
| AMD Ryzen 9 7950X | Cinebench R20 / single-core | 783 points | Graphics card: GeForce RTX 3090 System RAM: 32 GB |
| Intel Core Ultra 9 285K | Cinebench R23 / multi-core | 42705 points | |
| AMD Ryzen 9 7950X | Cinebench R23 / multi-core | 38248 points | Graphics card: GeForce RTX 3090 System RAM: 32 GB |
| Intel Core Ultra 9 285K | Cinebench R23 / single-core | 2353 points | |
| AMD Ryzen 9 7950X | Cinebench R23 / single-core | 2017 points | Graphics card: GeForce RTX 3090 System RAM: 32 GB |
Results were obtained on the reported systems. Test versions and settings remain separate; incomplete conditions do not support calculated model performance differences.
| Model | Result | Reported conditions |
|---|---|---|
| Intel Core Ultra 9 285K | 9189 points | System: 285K, RTX 5070 Ti, 128 GB CPU / power label: 285K, RTX 5070 Ti, 128 GB Source minimum runtime: 0 minutes. Exact test build and complete conditions are unreported; no ranking position. |
| Model | Result | Reported conditions |
|---|---|---|
| Intel Core Ultra 9 285K | 556 points | System: 285K, RTX 5070 Ti, 128 GB CPU / power label: 285K, RTX 5070 Ti, 128 GB Source minimum runtime: 0 minutes. Exact test build and complete conditions are unreported; no ranking position. |
| Model | Result | Reported conditions |
|---|---|---|
| AMD Ryzen 9 7950X | 20335.53635 H/s | RandomX / XMRig 6.26.0 / 1M / 32 threads / windows System RAM: 32 GB OS: Windows NT 10.0 Motherboard: ASUSTeK COMPUTER INC. / PRIME B650-PLUS Duration: 49.175 s User-submitted run; tuning and power settings are incomplete. |
| Model | Result | Reported conditions |
|---|---|---|
| Intel Core Ultra 9 285K | 13084.381174 H/s | RandomX / XMRig 6.22.2 / 1M / 24 threads / windows System RAM: 64 GB OS: Windows NT 10.0 Motherboard: ASUSTeK COMPUTER INC. / TUF GAMING B860-PLUS WIFI Duration: 76.427 s User-submitted run; tuning and power settings are incomplete. |


 English
 Russian
 German
 Portuguese
 Italian
 French
 Japan
Japan Spanish
 Polish
 Korean