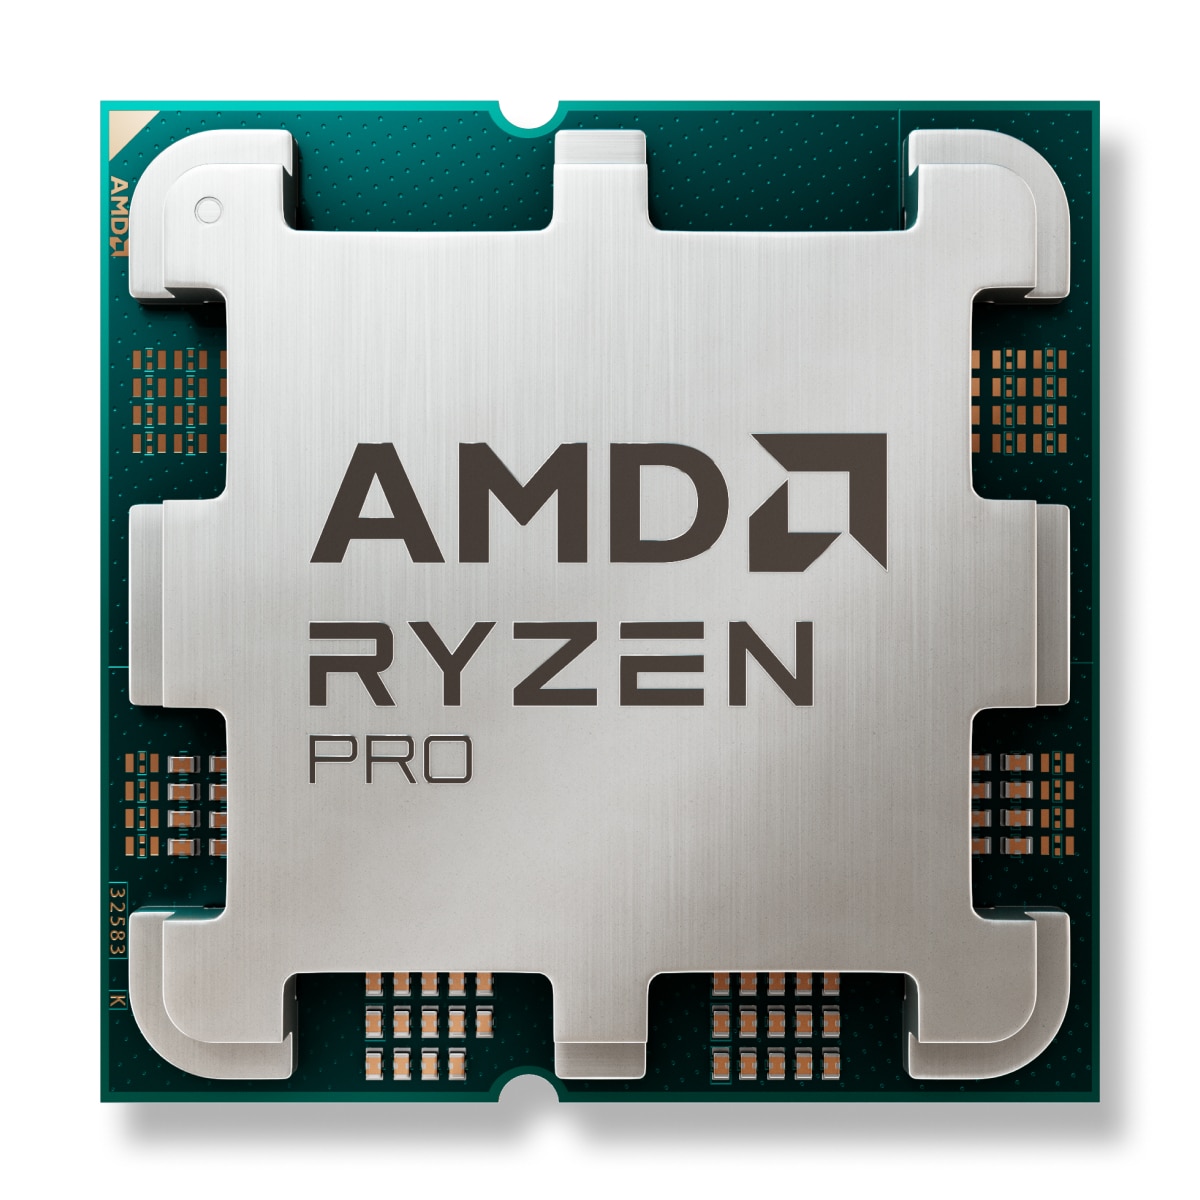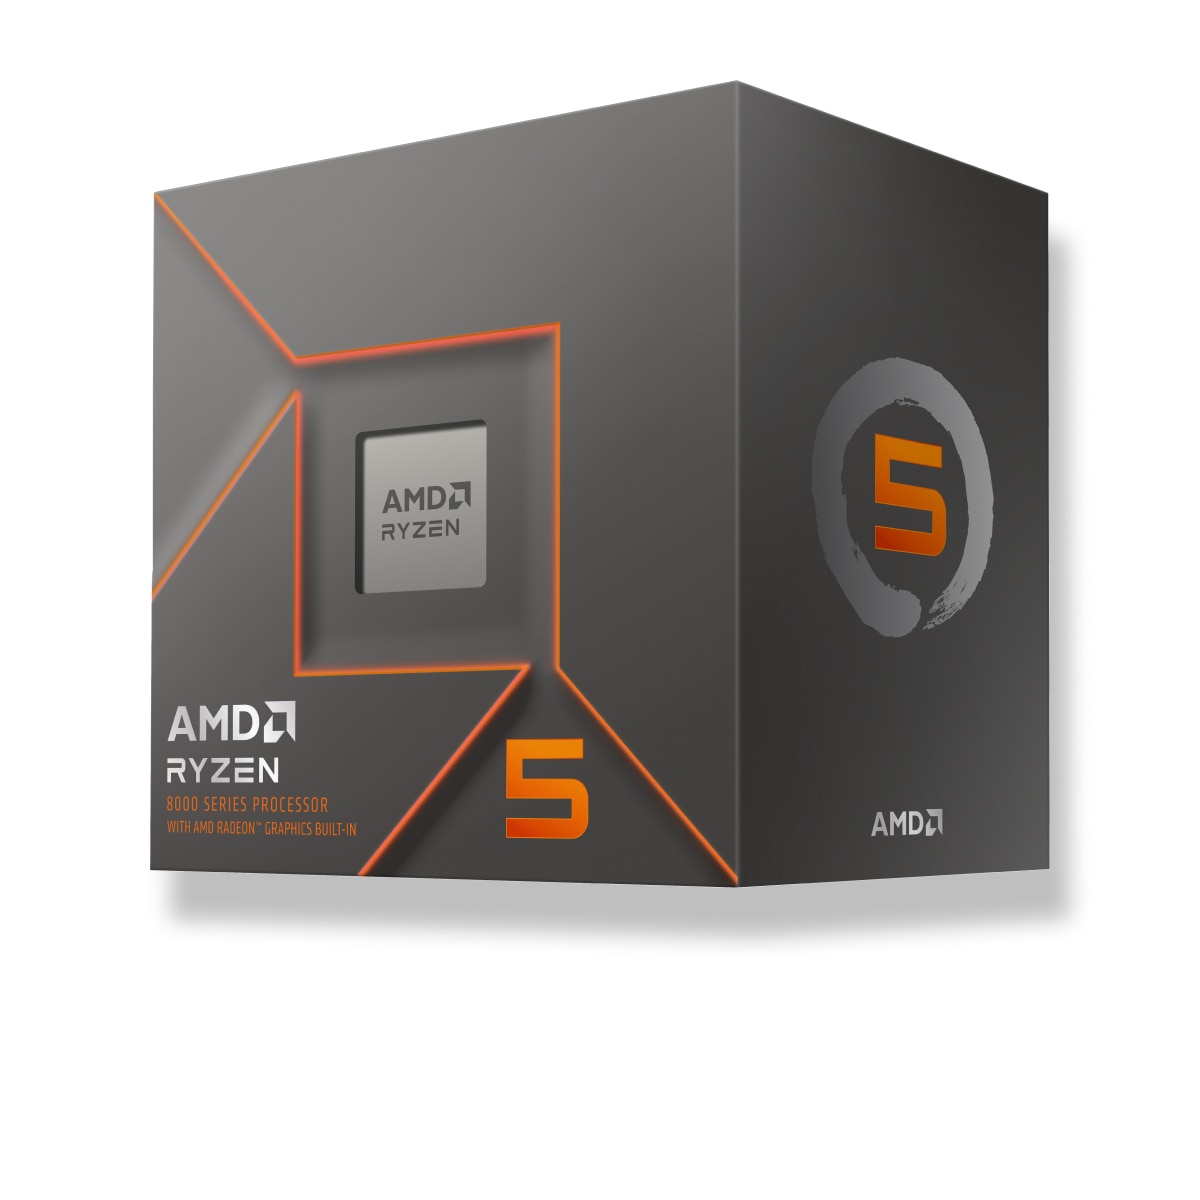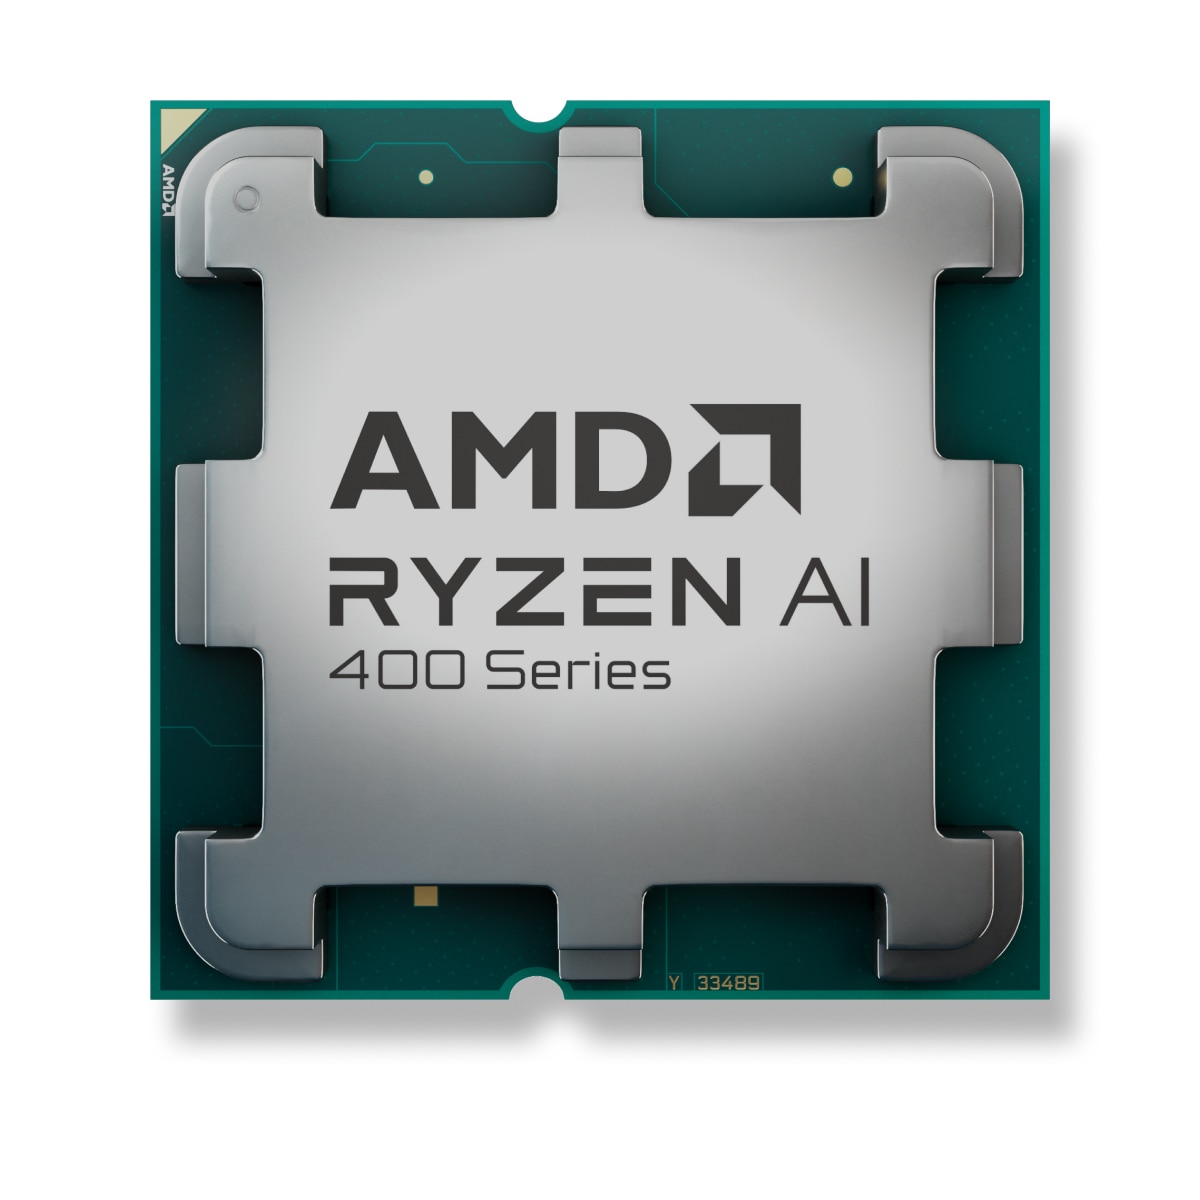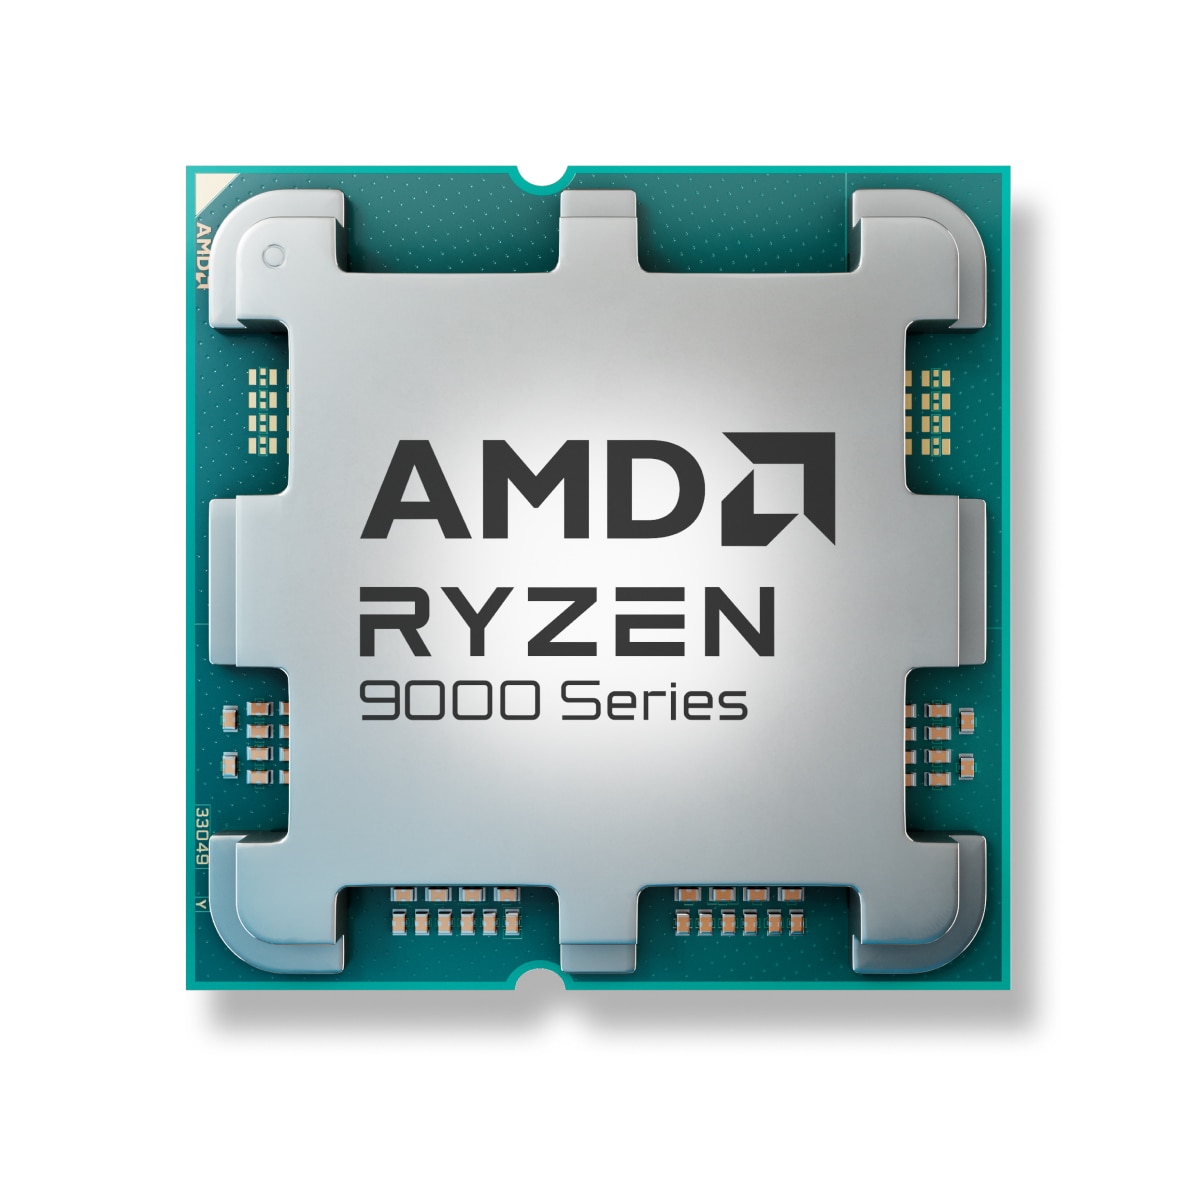
제품군 예시 이미지.
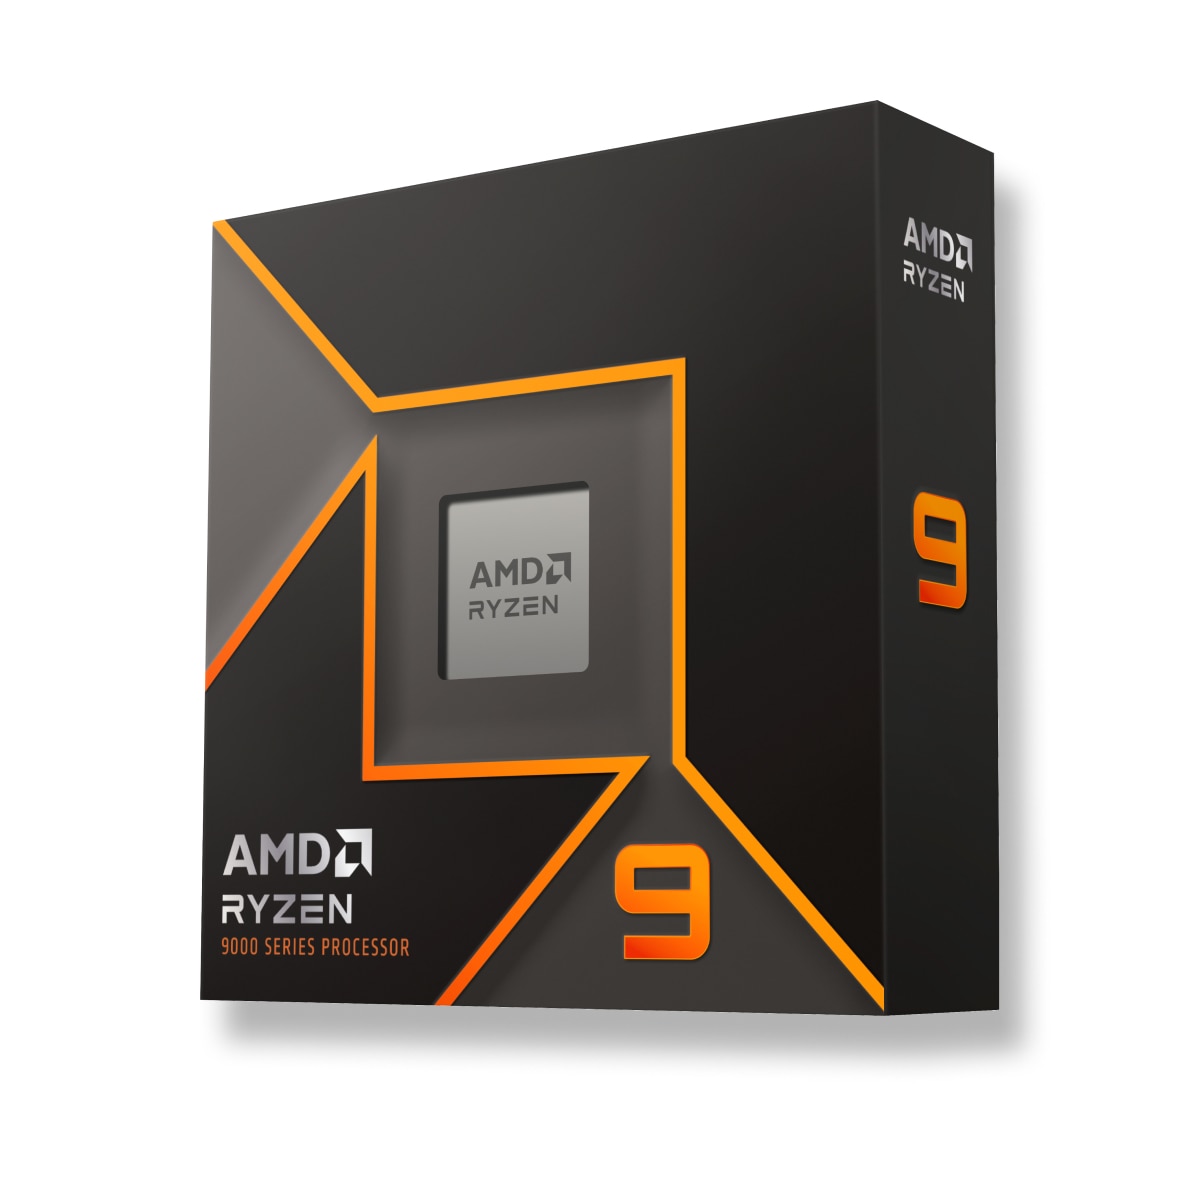
제품군 예시 이미지.
최선의 선택은 무엇인가요? AMD Ryzen 7 9850X3D 또는 AMD Ryzen 9 9900X? 哪种处理器更快?
Compare the available specifications of these models.
AMD Ryzen 7 9850X3D has a base frequency of 4.7 GHz. 8 / 16 CPU Cores / Threads. Stated TDP / base power 120 W. 에 출시 2026-01-29.
AMD Ryzen 9 9900X has a base frequency of 4.4 GHz. 12 / 24 CPU Cores / Threads. Stated TDP / base power 120 W. 에 출시 2024-08-15.
고려해야 하는 이유 더 빠른 클럭 속도
주변 7% 더 나은 클럭 속도
 4.4 GHz
공통 위치 AMD Ryzen 7 9850X3D 다른 모델과의 비교를 위한 인기 벤치마크의 CPU.
No data
고려해야 하는 이유 더 많은 코어 수
4 more cores
8
공통 위치 AMD Ryzen 9 9900X 다른 모델과의 비교를 위한 인기 벤치마크의 CPU.
No data
AMD Ryzen 7 9850X3D
비교 대상 프로세서, 시리즈, 세대 및 시장 부문에 대한 배경 정보.
 Ryzen
Desktops / Boxed Processor
Desktop
Ryzen 9000 Series
Ryzen
Desktops / Boxed Processor
Desktop
Ryzen 9000 Series
Core counts, threads, cache and clock modes describe the CPU configuration. Performance depends on the workload and comparable measured results.
4.4 GHz
12
24
5.6 GHz
예
5.6 GHz
내부 그래픽은 CPU의 성능에 영향을 미치지 않으며, 부재 시 또는 모바일 장치에서 그래픽 카드의 작업을 수행합니다.
2200 MHz
AMD Radeon Graphics
2
지원되는 RAM의 유형, 채널 수량 AMD Ryzen 9 9900X 그리고 AMD Ryzen 7 9850X3D. 마더보드에 따라 더 높거나 낮은 메모리 주파수가 지원될 수 있습니다.
2
DDR5
PCIe 5.0
TDP 요구 사항 비교 AMD Ryzen 7 9850X3D 그리고 AMD Ryzen 9 9900X Power specifications describe different manufacturer limits. TDP, base power and maximum turbo power are separate values; they do not establish measured system consumption.
120 W
95 °C
120 W
아키텍처, 인터페이스, 지원되는 추가 지침 AMD Ryzen 7 9850X3D 그리고 AMD Ryzen 9 9900X, 가상 머신 기술 및 프로세스 기술.
Zen 5
Granite Ridge AM5
TSMC 6nm FinFET
12 MB
64 MB
https://www.amd.com/en/products/processors/desktops/ryzen/9000-series/amd-ryzen-9-9900x.html
2024-08-15
AM5
TSMC 4nm FinFET
Explicit manufacturer fields refreshed; other original historical fields retained, not all reverified. Partial composite conflicts are preserved.
2026-09-30
Official median of community submissions. Higher is better; each row uses the same version, operating system and compute backend.
| Test | AMD Ryzen 7 9850X3D | AMD Ryzen 9 9900X |
|---|---|---|
| Blender 5.2.0 / CPU / Linux | 383.795396 samples/min Submissions: 6 | 542.129991 samples/min Submissions: 17 |
| Blender 5.2.0 / CPU / Windows | 371.301343 samples/min Submissions: 12 | 494.127396 samples/min Submissions: 31 |
Data snapshot: 2026-09-30. Official source
This aggregates different user systems. Individual measurement dates, RAM, drivers and power limits are unknown. Results are excluded from the legacy composite index.
Published measurements are separate from the archived index. Incomplete conditions and unknown run counts do not support ranking positions or calculated performance differences.
| Model | Test | Result | Reported conditions | Source / retrieved |
|---|---|---|---|---|
| AMD Ryzen 9 9900X | Cinebench R15 / multi-core | 5008 points | Graphics card: GeForce RTX 4090 |
Notebookcheck 2026-09-30 UTC |
| AMD Ryzen 9 9900X | Cinebench R15 / single-core | 353 points | Graphics card: GeForce RTX 4090 |
Notebookcheck 2026-09-30 UTC |
| AMD Ryzen 9 9900X | Cinebench R20 / multi-core | 12551 points | Graphics card: GeForce RTX 4090 |
Notebookcheck 2026-09-30 UTC |
| AMD Ryzen 9 9900X | Cinebench R20 / single-core | 885 points | Graphics card: GeForce RTX 4090 |
Notebookcheck 2026-09-30 UTC |
| AMD Ryzen 9 9900X | Cinebench R23 / multi-core | 32172 points | Graphics card: GeForce RTX 4090 |
Notebookcheck 2026-09-30 UTC |
| AMD Ryzen 9 9900X | Cinebench R23 / single-core | 2253 points | Graphics card: GeForce RTX 4090 |
Notebookcheck 2026-09-30 UTC |
| AMD Ryzen 9 9900X | Cinebench 2024 / multi-core | 1818 points | Graphics card: GeForce RTX 4090 |
Notebookcheck 2026-09-30 UTC |
| AMD Ryzen 9 9900X | Cinebench 2024 / single-core | 138 points | Graphics card: GeForce RTX 4090 |
Notebookcheck 2026-09-30 UTC |
No comparable legacy benchmark results are available.
These are saved results from the earlier catalog. Measurement dates and test configurations were not recorded. Models with no comparable results are omitted.
Recent models: test results with identified primary sources — Cinebench R23 · Cinebench R20 · Cinebench R15 · Cinebench 2026 · RandomX benchmark


 English
 Russian
 German
 Portuguese
 Italian
 French
 Japan
Japan Spanish
 Polish
 Chinese