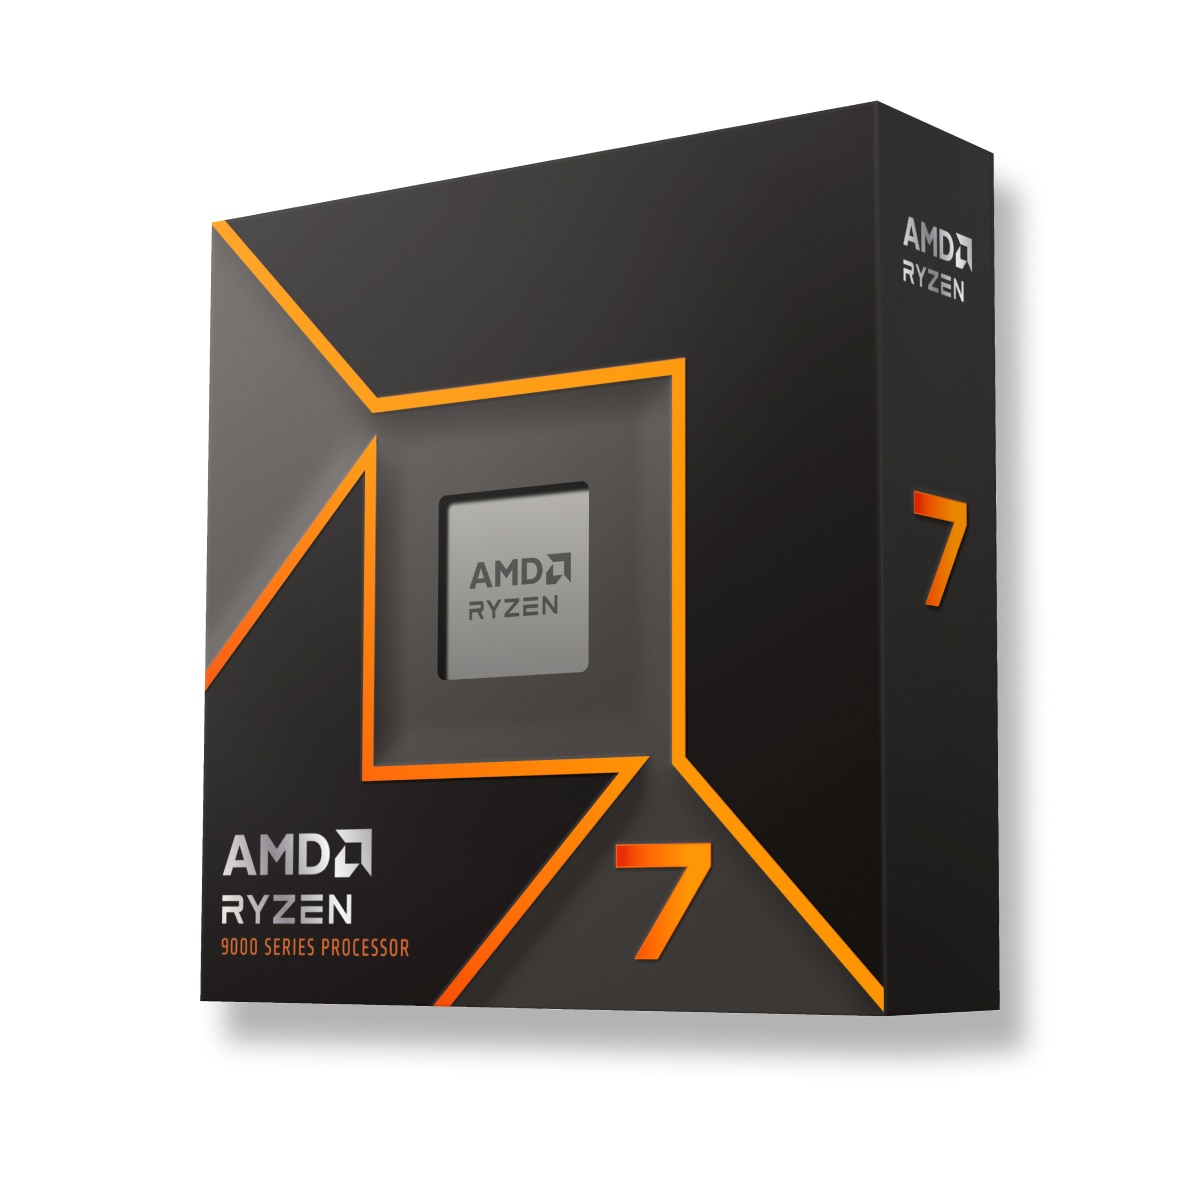
共通ポジション AMD Ryzen 7 9700X 他機種との比較のため、一般的なベンチマークでCPUを比較。.
No dataOfficial median of community submissions; higher is better. Blender versions, operating systems and compute backends remain separate.
Snapshot date is the retrieval date, not the measurement date. Individual dates, RAM, drivers and power limits are unknown. This aggregates different user systems; it is not a test of a specific partner board and is excluded from the legacy composite index.
Published measurements are separate from the archived index. Incomplete conditions and unknown run counts do not support ranking positions or calculated performance differences.
| Test | Result | Reported conditions | Source / retrieved |
|---|---|---|---|
| Cinebench R15 / multi-core | 3178 points | Graphics card: GeForce RTX 4090 System RAM: 32 GB |
Notebookcheck 2026-09-30 UTC |
| Cinebench R15 / single-core | 346 points | Graphics card: GeForce RTX 4090 System RAM: 32 GB |
Notebookcheck 2026-09-30 UTC |
| Cinebench R20 / multi-core | 7956 points | Graphics card: GeForce RTX 4090 System RAM: 32 GB |
Notebookcheck 2026-09-30 UTC |
| Cinebench R20 / single-core | 870 points | Graphics card: GeForce RTX 4090 System RAM: 32 GB |
Notebookcheck 2026-09-30 UTC |
| Cinebench R23 / multi-core | 20485 points | Graphics card: GeForce RTX 4090 System RAM: 32 GB |
Notebookcheck 2026-09-30 UTC |
| Cinebench R23 / single-core | 2211 points | Graphics card: GeForce RTX 4090 System RAM: 32 GB |
Notebookcheck 2026-09-30 UTC |
| Cinebench 2024 / multi-core | 1203 points | Graphics card: GeForce RTX 4090 System RAM: 32 GB |
Notebookcheck 2026-09-30 UTC |
| Cinebench 2024 / single-core | 136 points | Graphics card: GeForce RTX 4090 System RAM: 32 GB |
Notebookcheck 2026-09-30 UTC |
| RandomX / XMRig 6.22.2 / 10M / 16 threads | 14490.17 H/s | System RAM: 64 GB OS: Windows NT 10.0 Motherboard: ASRock / B850I Lightning WiFi Duration: 690.123 s |
XMRig 2026-09-30 UTC |
No comparable legacy benchmark results are available.
These are saved results from the earlier catalog. Measurement dates and test configurations were not recorded. Models with no comparable results are omitted.
Recent models: test results with identified primary sources — Cinebench R23 · Cinebench R20 · Cinebench R15 · Cinebench 2026 · RandomX benchmark
Comparable benchmark results are required to suggest performance alternatives.
*
PL1 is the sustained processor power limit; PL2 is the short-term turbo power limit. They are not measured performance or efficiency.
この値は、最適な冷却システムと電源を選択するために使用されます。


 English
 Russian
 German
 Portuguese
 Italian
 French
 Spanish
 Polish
 Chinese
 Korean