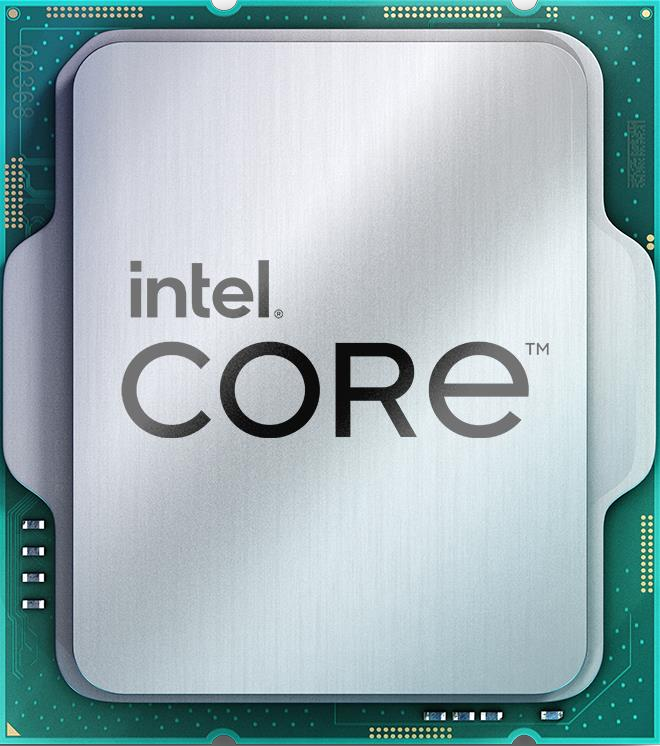
Abbildung der Produktfamilie. Credit: Intel Corporation.
Gemeinsame Standpunkte Intel Core i7-14700K CPU in gängigen Benchmarks, zum Vergleich mit anderen Modellen.
No dataOfficial median of community submissions; higher is better. Blender versions, operating systems and compute backends remain separate.
Snapshot date is the retrieval date, not the measurement date. Individual dates, RAM, drivers and power limits are unknown. This aggregates different user systems; it is not a test of a specific partner board and is excluded from the legacy composite index.
Published measurements are separate from the archived index. Incomplete conditions and unknown run counts do not support ranking positions or calculated performance differences.
| Test | Result | Reported conditions | Source / retrieved |
|---|---|---|---|
| Cinebench R15 / multi-core | 5459 points | Graphics card: GeForce RTX 4090 System RAM: 16 GB |
Notebookcheck 2026-09-30 UTC |
| Cinebench R15 / single-core | 314 points | Graphics card: GeForce RTX 4090 System RAM: 16 GB |
Notebookcheck 2026-09-30 UTC |
| Cinebench R20 / multi-core | 13672 points | Graphics card: GeForce RTX 4090 System RAM: 16 GB |
Notebookcheck 2026-09-30 UTC |
| Cinebench R20 / single-core | 832 points | Graphics card: GeForce RTX 4090 System RAM: 16 GB |
Notebookcheck 2026-09-30 UTC |
| Cinebench R23 / multi-core | 35892 points | Graphics card: GeForce RTX 4090 System RAM: 16 GB |
Notebookcheck 2026-09-30 UTC |
| Cinebench R23 / single-core | 2153 points | Graphics card: GeForce RTX 4090 System RAM: 16 GB |
Notebookcheck 2026-09-30 UTC |
| Cinebench 2024 / multi-core | 1982 points | Graphics card: GeForce RTX 4090 System RAM: 16 GB |
Notebookcheck 2026-09-30 UTC |
| Cinebench 2024 / single-core | 127.9 points | Graphics card: GeForce RTX 4090 System RAM: 16 GB |
Notebookcheck 2026-09-30 UTC |
No comparable legacy benchmark results are available.
These are saved results from the earlier catalog. Measurement dates and test configurations were not recorded. Models with no comparable results are omitted.
Recent models: test results with identified primary sources — Cinebench R23 · Cinebench R20 · Cinebench R15 · Cinebench 2026 · RandomX benchmark
Comparable benchmark results are required to suggest performance alternatives.
*
PL1 is the sustained processor power limit; PL2 is the short-term turbo power limit. They are not measured performance or efficiency.
Die Werte werden zur Auswahl des optimalen Kühlsystems und der Stromversorgung verwendet.


 English
 Russian
 Portuguese
 Italian
 French
 Japan
Japan Spanish
 Polish
 Chinese
 Korean