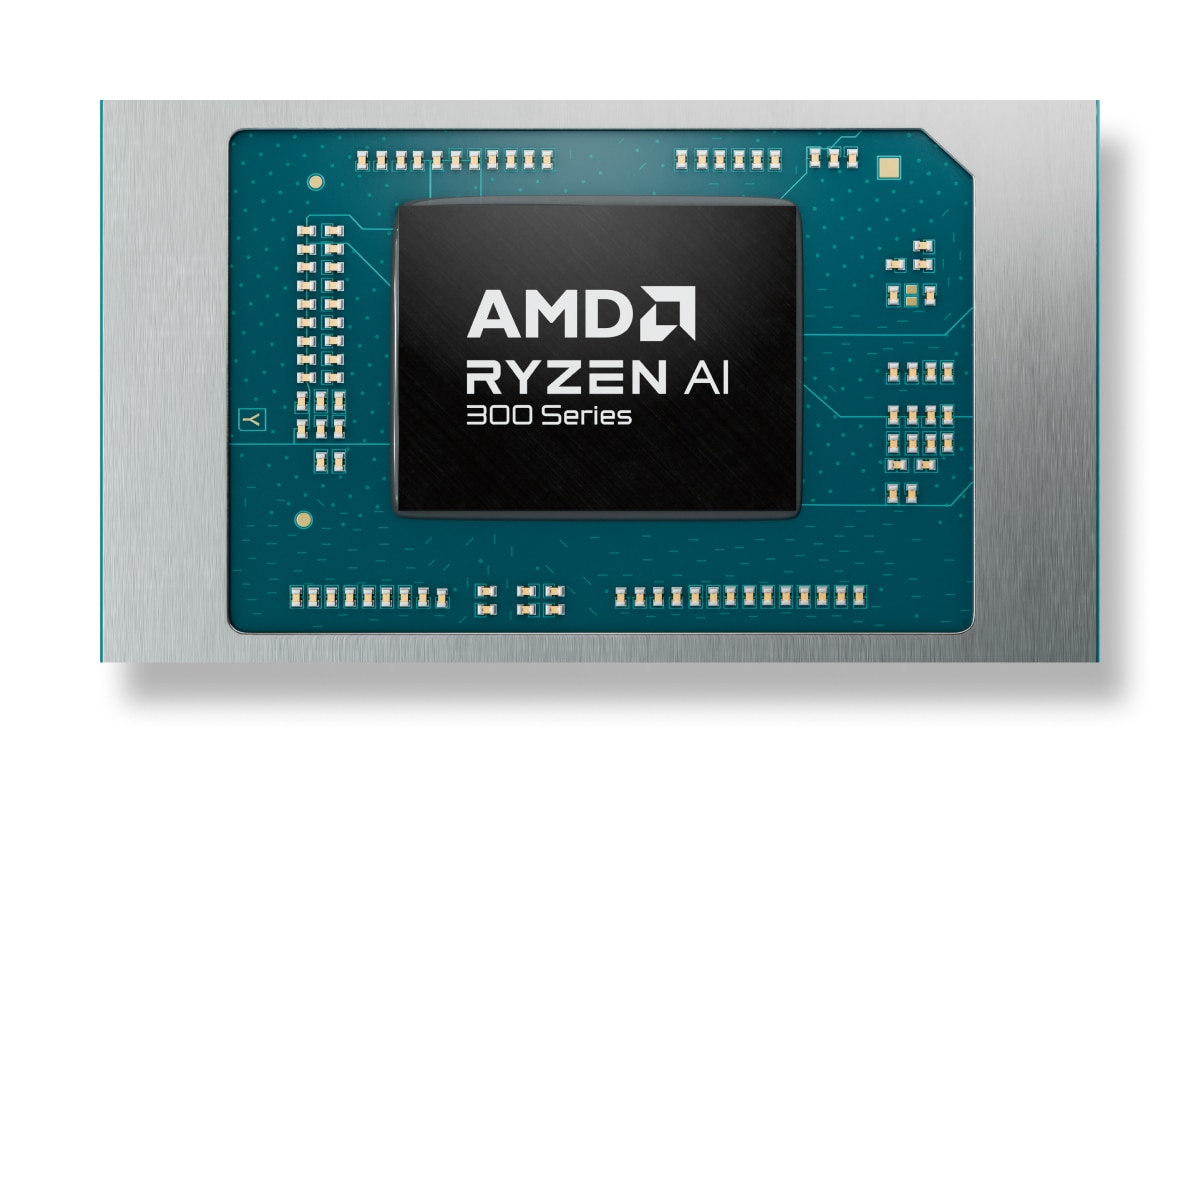
Gemeinsame Standpunkte AMD Ryzen 7 4800H CPU in gängigen Benchmarks, zum Vergleich mit anderen Modellen.
Published results: 3
Each row uses one Blender version, operating system and compute backend.
| Test and settings | AMD Ryzen 7 4800H |
|---|---|
| Blender 5.1.1 / CPU / Linux | 159.159978 samples/min Submissions: 6 |
| Blender 5.1.1 / CPU / Windows | 126.971286 samples/min Submissions: 8 |
| Blender 5.2.0 / CPU / Windows | 138.995644 samples/min Submissions: 5 |
Results were obtained on the reported systems. Test versions and settings remain separate; incomplete conditions do not support calculated model performance differences.
| Result | Reported conditions |
|---|---|
| 2935.133549 H/s | RandomX / XMRig 6.24.0 / 1M / 4 threads / linux System RAM: 16 GB OS: Linux x86_64 Motherboard: ASUSTeK COMPUTER INC. / FA506II Duration: 340.7 s User-submitted run; tuning and power settings are incomplete. |
| Result | Reported conditions |
|---|---|
| 11267 points | System: HP Omen 15-en0375ng via HP Deutschland CPU / power label: R7 4800H 65 W / 54 W Graphics: GeForce RTX 2060 Mobile 960 / 1375 MHz 6 GB RAM: 16 GB Exact test build and complete conditions are unreported; no ranking position. |
| Result | Reported conditions |
|---|---|
| 1248 points | System: HP Omen 15-en0375ng via HP Deutschland CPU / power label: R7 4800H 65 W / 54 W Graphics: GeForce RTX 2060 Mobile 960 / 1375 MHz 6 GB RAM: 16 GB Exact test build and complete conditions are unreported; no ranking position. |
| Result | Reported conditions |
|---|---|
| 4380 points | System: HP Omen 15-en0375ng via HP Deutschland CPU / power label: R7 4800H 65 W / 54 W Graphics: GeForce RTX 2060 Mobile 960 / 1375 MHz 6 GB RAM: 16 GB Exact test build and complete conditions are unreported; no ranking position. |
| Result | Reported conditions |
|---|---|
| 486 points | System: HP Omen 15-en0375ng via HP Deutschland CPU / power label: R7 4800H 65 W / 54 W Graphics: GeForce RTX 2060 Mobile 960 / 1375 MHz 6 GB RAM: 16 GB Exact test build and complete conditions are unreported; no ranking position. |
| Result | Reported conditions |
|---|---|
| 1909 points | System: HP Omen 15-en0375ng via HP Deutschland CPU / power label: R7 4800H 65 W / 54 W Graphics: GeForce RTX 2060 Mobile 960 / 1375 MHz 6 GB RAM: 16 GB Exact test build and complete conditions are unreported; no ranking position. |
| Result | Reported conditions |
|---|---|
| 188 points | System: HP Omen 15-en0375ng via HP Deutschland CPU / power label: R7 4800H 65 W / 54 W Graphics: GeForce RTX 2060 Mobile 960 / 1375 MHz 6 GB RAM: 16 GB Exact test build and complete conditions are unreported; no ranking position. |
Vergleichen Sie die Ergebnisse beliebter Benchmarks AMD Ryzen 7 4800H mit anderen Prozessoren, um die tatsächliche Geschwindigkeit der CPU bei der Verarbeitung von Inhalten zu verstehen.
Die Tests umfassen mathematische Berechnungen, die Erstellung von 3D-Modellen, das Mining von Kryptowährungen, Tests im Single- und Multi-Core-Modus.
These are saved results from the earlier catalog. Measurement dates and test configurations were not recorded. Models with no comparable results are omitted.
Recent models: test results with identified primary sources — Cinebench R23 · Cinebench R20 · Cinebench R15 · Cinebench 2026 · RandomX benchmark
Higher values are better in this metric.
Higher values are better in this metric.
Higher values are better in this metric.
Higher values are better in this metric.
Higher values are better in this metric.
Higher values are better in this metric.
Higher values are better in this metric.
Higher values are better in this metric.
Higher values are better in this metric.
Higher values are better in this metric.
These are saved results from the earlier catalog. Measurement dates and test configurations were not recorded. Models with no comparable results are omitted. Index 0–100: equal-weight mean of each score relative to the best saved score among models with both tests. Tests: Cinebench R23 Multi-Core + Geekbench 5 Multi-Core. This index does not predict performance in every workload.
Recent models: test results with identified primary sources — Cinebench R23 · Cinebench R20 · Cinebench R15 · Cinebench 2026 · RandomX benchmark
*
PL1 is the sustained processor power limit; PL2 is the short-term turbo power limit. They are not measured performance or efficiency.
Die Werte werden zur Auswahl des optimalen Kühlsystems und der Stromversorgung verwendet.


 English
 Russian
 Portuguese
 Italian
 French
 Japan
 Spanish
 Polish
 Chinese
 Korean